.png)
Which robot is right depends less on the robot than on your production. The clearest way I know to show it is to run the same question twice: once for a machine with a few products in long series, and once for a machine with many products in short series.
We did that in our production economics model, with a fixed robot, a collaborative robot and a mobile robot. Both cases below are example calculations, not customer results.
Case 1: three products, high volume
| Fixed robot | Collaborative robot | Mobile robot | |
|---|---|---|---|
| Share of volume run by the robot | 100 % | 100 % | 100 % |
| Productivity increase | 49 % | 11 % | 52 % |
| Gross profit increase per year | €110,000 | €90,000 | €140,000 |
| Operators freed | 1.6 | 1.6 | 1.9 |
"Operators freed" is how many people the robot releases for other work in the calculation.
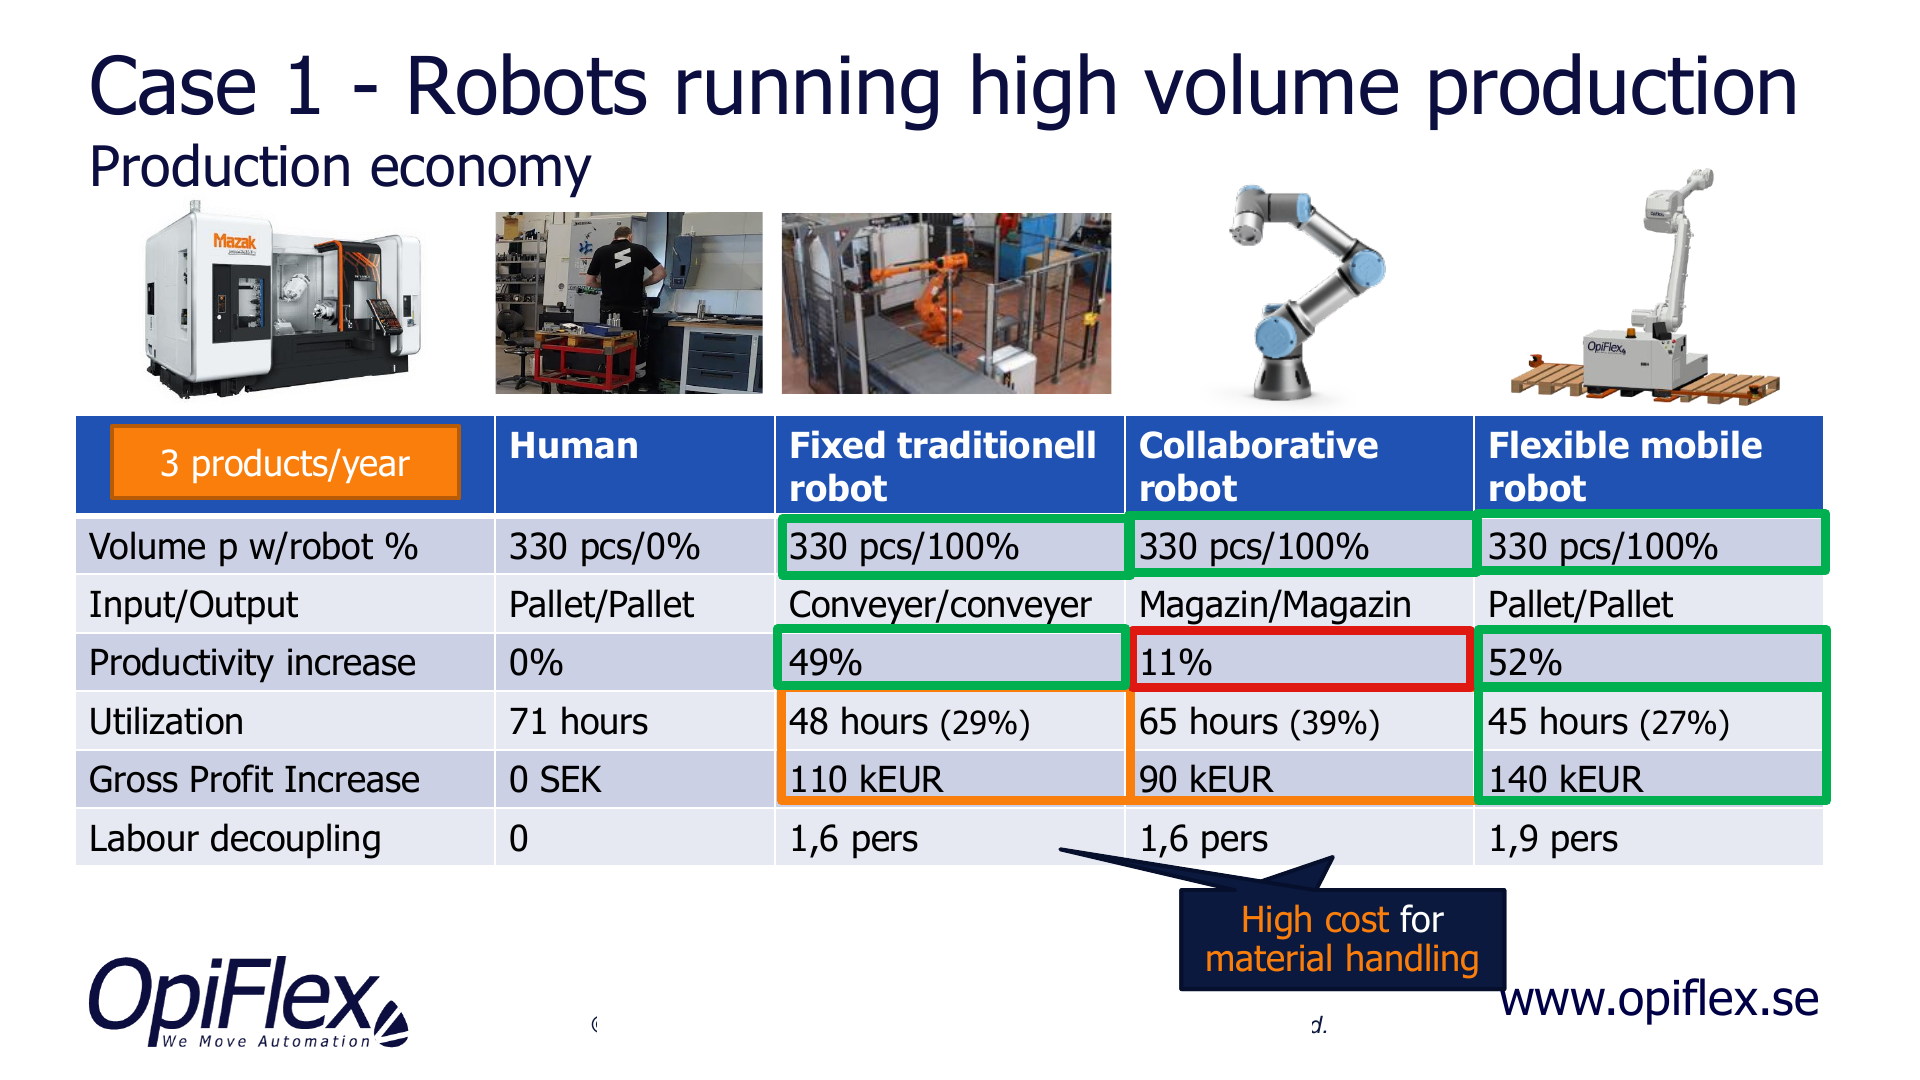
With few products, all three pay off. The robot runs the whole volume whichever type you choose. A fixed robot is a proven and good choice here. The mobile robot comes out somewhat ahead in this example.
Case 2: 230 products, high mix
| Fixed robot | Collaborative robot | Mobile robot | |
|---|---|---|---|
| Share of volume run by the robot | 20 % | 80 % | 80 % |
| Productivity increase | 49 % | 9 % | 49 % |
| Gross profit increase per year | –€120,000 | €68,000 | €110,000 |
| Operators freed | 0.3 | 1.2 | 1.5 |
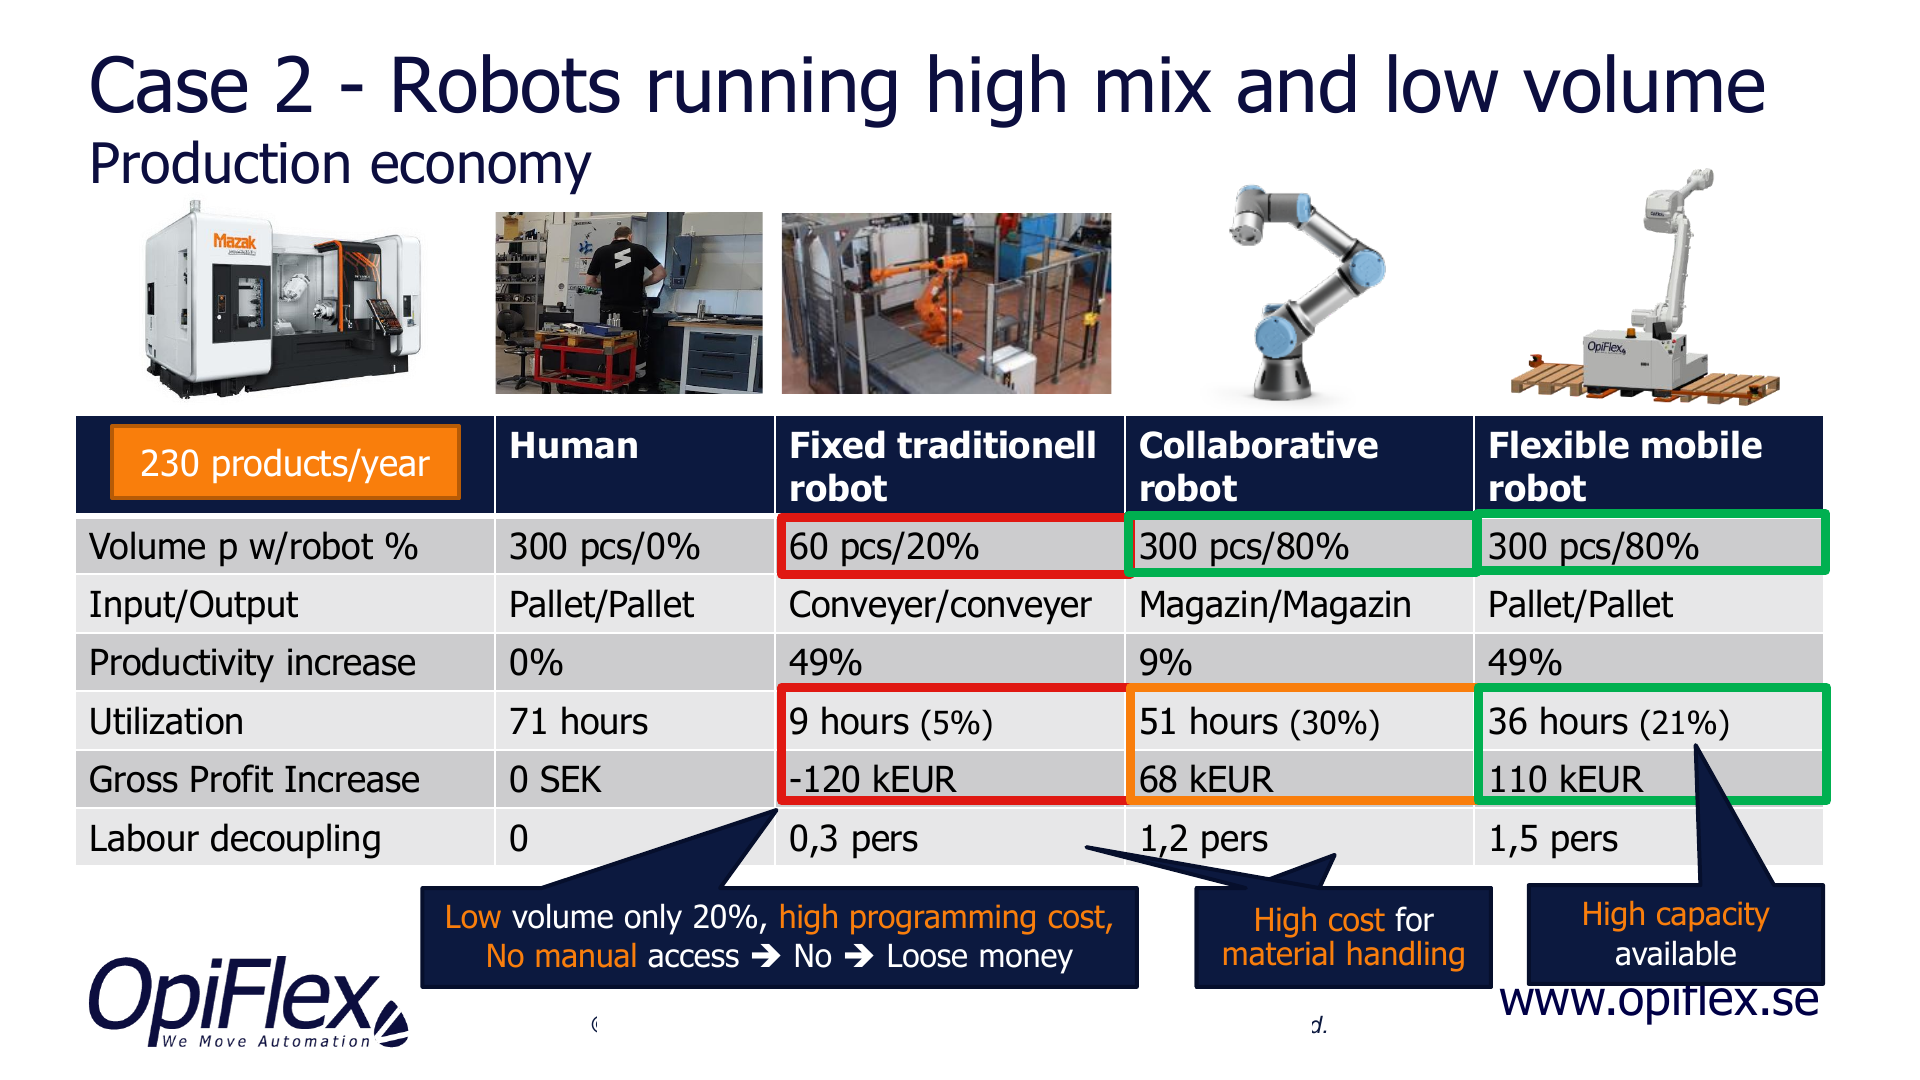
With 230 products, the picture changes. Look at the first row. The fixed robot runs only 20 % of the volume, and in this calculation that gives a negative result. The collaborative robot and the mobile robot both run 80 % of the volume. The mobile robot does it with the same productivity gain as the fixed robot.
The share of volume is where the programming time shows up. When a new part takes 10–60 hours to program, only the longest series are worth moving to the robot. With the Dynamic Program Generator, an operator creates a new program in 1–3 minutes, so most of the parts can go to the robot.
How to read your own production
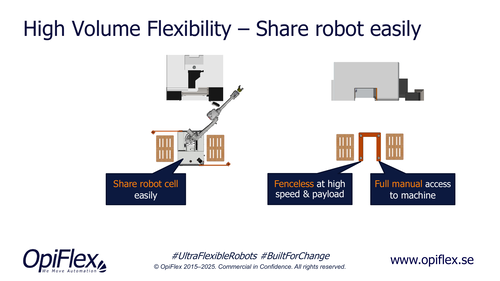
Start with three questions. How many products per machine and year? How long does a typical series run? How many machines could share a robot?
Few products and long series: a fixed cell is often the right answer, and we will say so. Many products and short series: programming time and the ability to move the robot between machines decide the outcome.
If you tell us roughly how many parts you run per machine and year, we can run the same calculation with your own figures, in our production economics model validated by Chalmers University of Technology. Contact us.
Related articles
-
Hidden costs in a robot investment: ROI example | OpiFlex
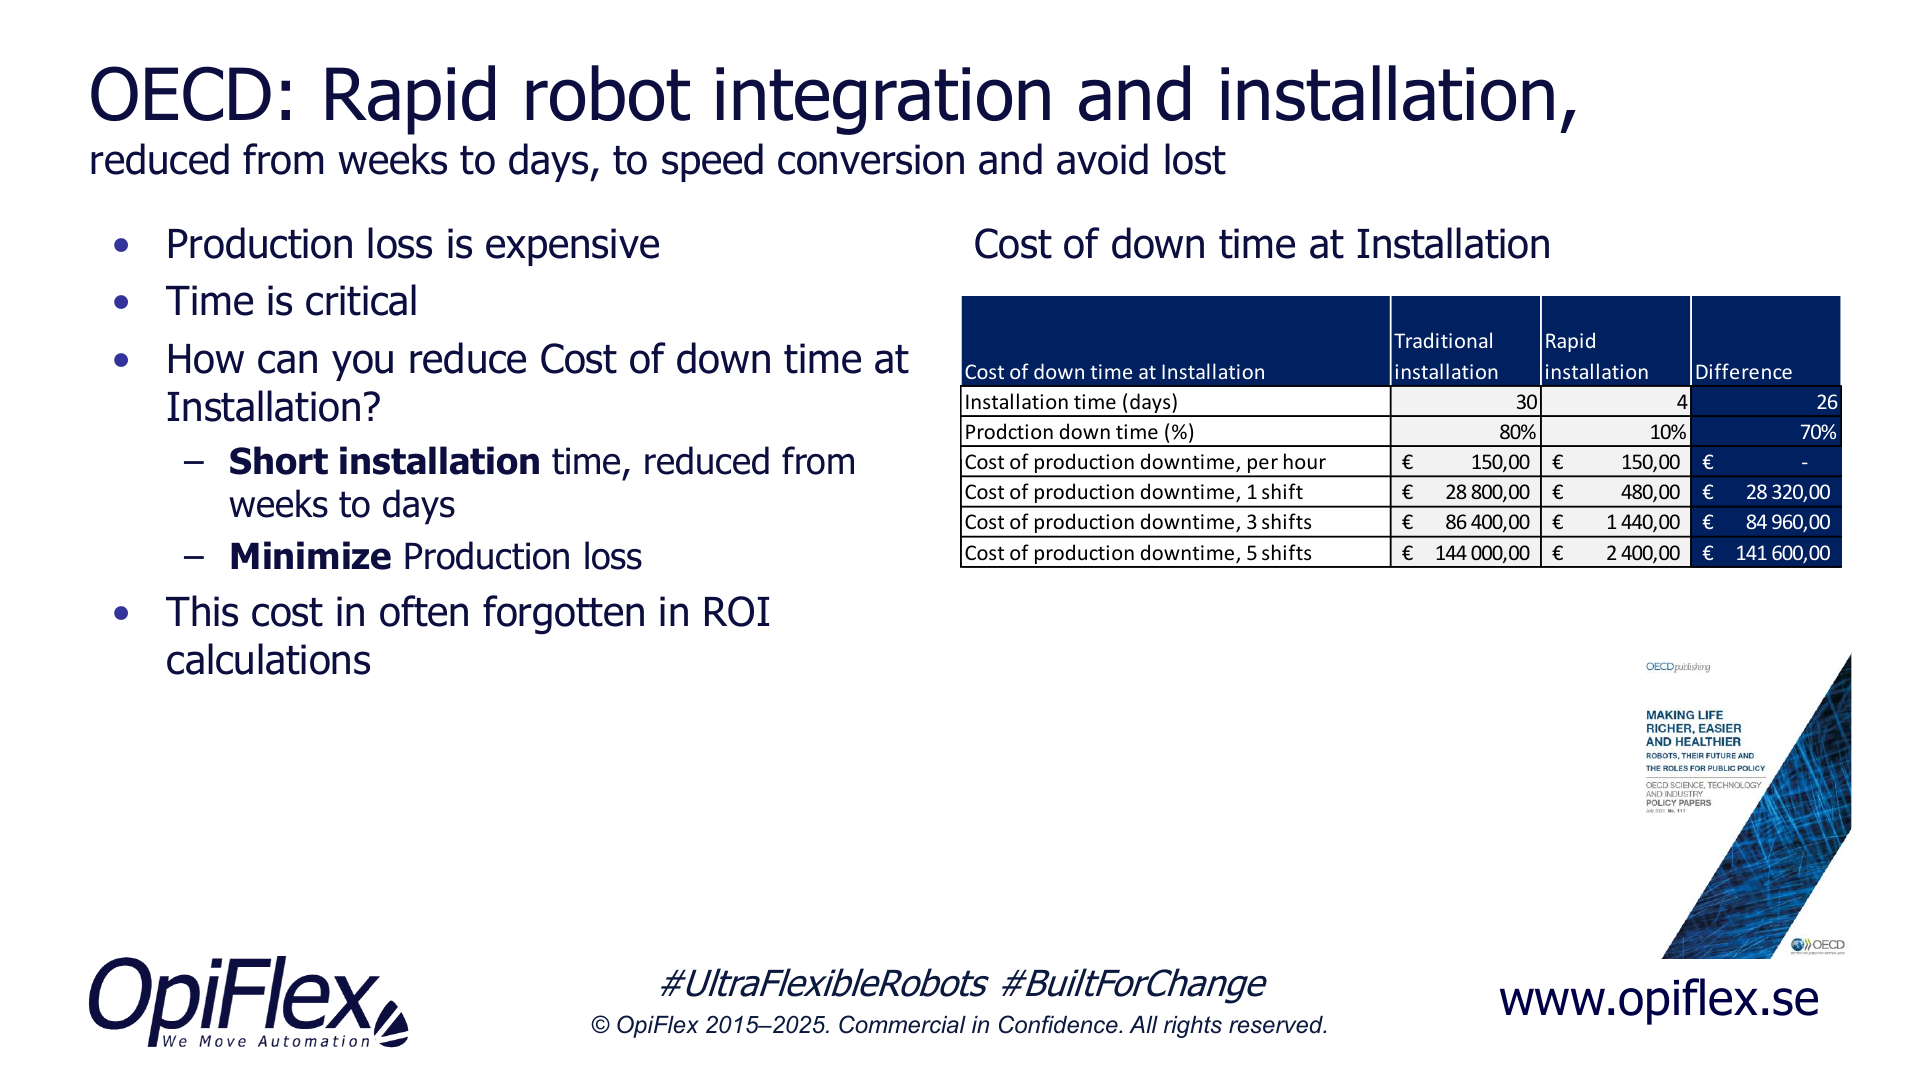
Installation stops, new products and weeks of waiting rarely appear in a robot ROI calculation. Example figures for what they cost, per shift.
Read more -
Five needs from 100+ manufacturers (OECD) | OpiFlex
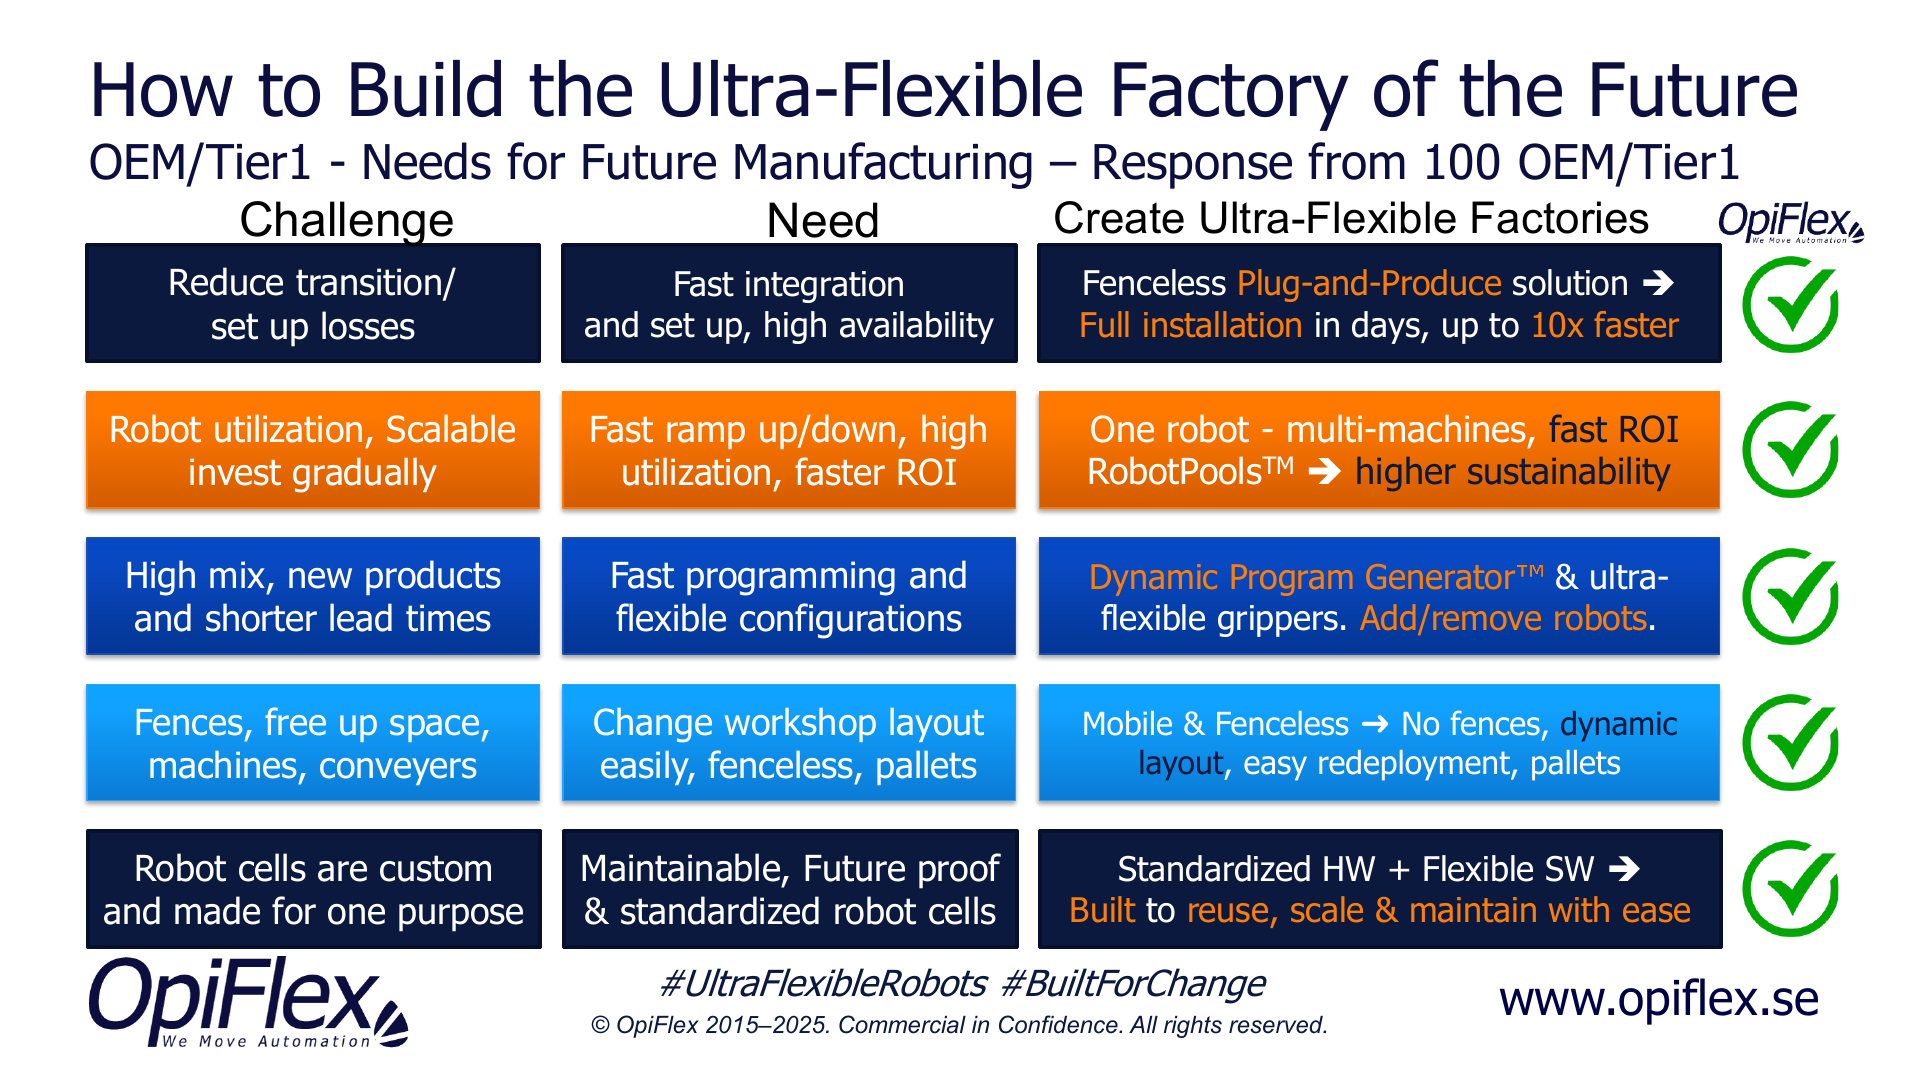
Fast installation, fast scale-up and scale-down, fast programming, layouts without fences and standardised cells. Five needs we hear from 100+ manufacturers.
Read more -
One robot, several CNC machines: machine tending | OpiFlex
When one robot moves between several CNC machines, small batches and night shifts start to pay. How machine shops use a mobile robot cell, with a real case.
Read more